Boring stocks vs Growth stocks
A data-driven attempt to settle the debate.

Everything is priced in, right?
Well, let’s see.
Using data from Financial Modeling Prep’s API, I have compiled statistics on more than 8000 companies across the US, EUR and AU markets to investigate potential systematic biases in business valuation.
These results are based on data from 1980 to 2023.
Ratio vs. Annualized returns
The following table shows the correlations between various Valuation Ratios and Annualized Returns (with reinvested dividends) across all companies -regardless of industry.
Usually, price is in the numerator of valuation ratios but I reversed them, because it makes more sense for correlation computation1.
So far, the positive correlations support the value investing approach.
The P/B ratio has the best correlation with annualized returns, despite being less popular than P/E or P/FCF.
Let’s break it down by industry. Doing so decreases sample sizes and results in correlations that are less reliable. So take these figures with a grain of salt, especially when the sample size is below 100.
Here, a negative correlation suggests investors overemphasize current valuations, potentially overlooking negative future developments (or conversely, dismissing positive forecasts). A positive correlation suggests investors tend to be overconfident in their ability to predict the future.
It looks like a win for value investors. Most of the time, undervalued companies (in terms of valuation ratios) tend to outperform the ones with better “potential”.
But let’s take a step back.
What about 5-year returns?
Average(Annualized return) ≠ Annualized Average Return
When I averaged the annual returns in my dataset, I was surprised to get a negative number. I assumed I had made a mistake because everyone knows that, on average and in the long run, investing in stocks yields a positive return. So I checked every single line of code. There was no obvious blunder…
In fact, I realized that gains compound, but losses don't offset them linearly. For example, consider two investments held equally: one yielding a 50% annual return over five years and the other yielding -50% per year. The overall return would be 281%, not zero2. When I compounded each annual return over five years and then averaged the results, I obtained a 4% positive average annual return. Given that this is an unweighted average, it seems reasonable.
The preceding correlations don't account for the asymmetry between positive and negative annualized returns. They treat both equally3. However, growth stocks are considered high-risk, high-reward investments. This implies that, for a similar average annualized return, they should outperform value stocks.
To illustrate this phenomenon, the following graph shows the returns of 2 hypothetical portfolios of 2 stocks.
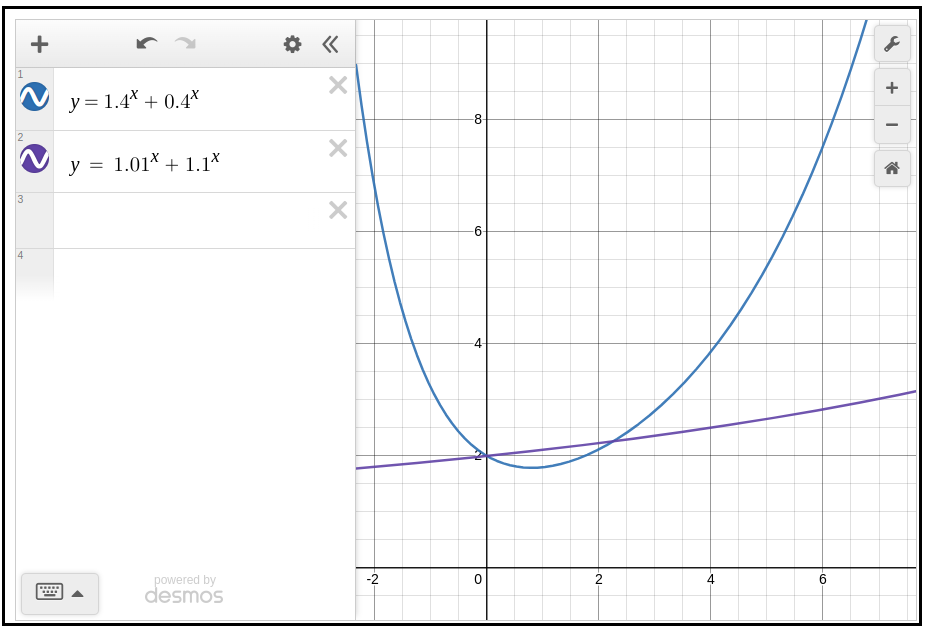
Despite a lower Average(annualized_returns), the high risk/high reward portfolio outperforms the other on a 5-year period.
So, let’s check the correlations between valuation ratios and 5-year returns.
These correlations remain significant, but they are much lower than for annualized returns.
A caveat: Calculating 5-year returns by exponentiating values, as done above, increases sensitivity to data inaccuracies. Correlations with 10-year returns are excluded, largely due to this issue. These correlations were all positive but insignificant, with the exception of Book Value / Price.
Valuation Ratios vs. Stock Volatility
We've established that 'transversal variance' is a good thing. A portfolio with some strong winners and some weak performers is preferable to a uniformly 'meh' one. In the long run, that unevenness pays off.
But volatility (internal variance) is terrible. Kelly's criterion demonstrates how damaging it is to ROI. You can't risk everything on volatile stocks (especially debt). The money sitting on the sidelines won't generate returns.
So here are the correlations between valuation ratios and the standard deviation of year-over-year returns.
I find it a bit odd: I thought undervalued companies were considered riskier, and that their risk was a reason for their undervaluation. But they are actually less volatile.
Banks and asset management firms are exceptions. Investors seem especially good at assessing and pricing in their risks. These are the only industries where undervaluation reliably correlates positively (and reliably, i.e, with a large sample size) with stock volatility.
Still, the STD of yearly returns gives an incomplete picture. Using the beta coefficient instead would have been a better option. Please contact me if you want me to add the Ratios vs Beta correlations to this analysis; I haven't computed those yet.
Conclusion
Investors seem to exhibit a slight, systematic bias toward believing they can predict the future and capitalize on it. Value investing appears somewhat more effective than growth investing.
Appendix: methodology
I used FMP’s API to gather financial data, focusing on US, European, and Australian public companies due to their more complete and reliable information. I screened approximately 15,000 businesses, initially filtering for:
Companies listed for over 5 years
Data accuracy (excluding outliers or inconsistencies like incorrect financial figures or improperly adjusted share counts for stock splits)
This process narrowed the dataset to 8,725 companies.
To calculate returns, I excluded the first two years of each company's public data and then computed returns with reinvested dividends, up to the last available data points.
Ratios were calculated using each company's third public financial statement, along with the stock price following its release.
P/E ratios of -500 or +500 have basically the same “meaning”, while they are polar opposites. Reversing the ratios gives -0.002 and +0.002, which are close together. It effectively reflects that you’re paying a lot for current profits. The 1/x function is not monotonic, which is bad for correlation computation.
In the no-rebalancing case the “average” overall multiplier (when combining the two separate outcomes) would be the mean of (1.5⁵) and (0.5⁵); that is, (7.59 + 0.03)/2 ≈ 3.81, corresponding to a total return of about +281%
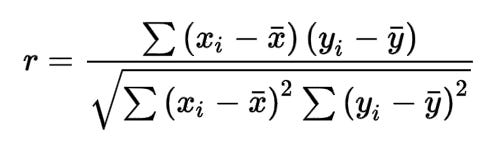
You can get a sense of it by looking at the formula.